
Introduction to Candlestick Charts
Candlestick charts are one of the most widely used tools in Forex, cryptocurrency, and stock trading. Professional traders rely on candlestick patterns to analyze market behavior and predict future price movements.
Originally developed in Japan during the 18th century for rice trading, candlestick charts have become the foundation of modern technical analysis.
Unlike simple line charts, candlestick charts provide detailed information about price movement within a specific time period.
Each candlestick represents four key prices:
Open price
Close price
High price
Low price
By analyzing these values, traders can understand the battle between buyers and sellers in the market.
Understanding Candlestick Structure

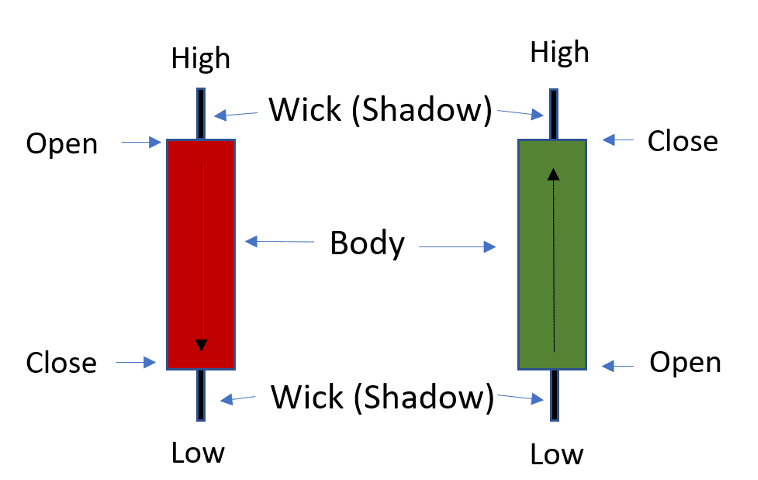


Every candlestick has two main parts:
The Body
The body represents the difference between the opening and closing prices.
If the close price is higher than the open price, the candle becomes bullish, usually shown in green.
If the close price is lower than the open price, the candle becomes bearish, usually shown in red.
The Wick (Shadow)
The thin lines extending above and below the body are called wicks or shadows. They represent the highest and lowest prices reached during that time period.
Why Candlestick Charts Are Important
Candlestick charts help traders:
Understand market sentiment
Identify trend reversals
Detect strong buying or selling pressure
Find better entry and exit points
Because of this, candlestick patterns are considered the foundation of price action trading.
Single Candlestick Patterns

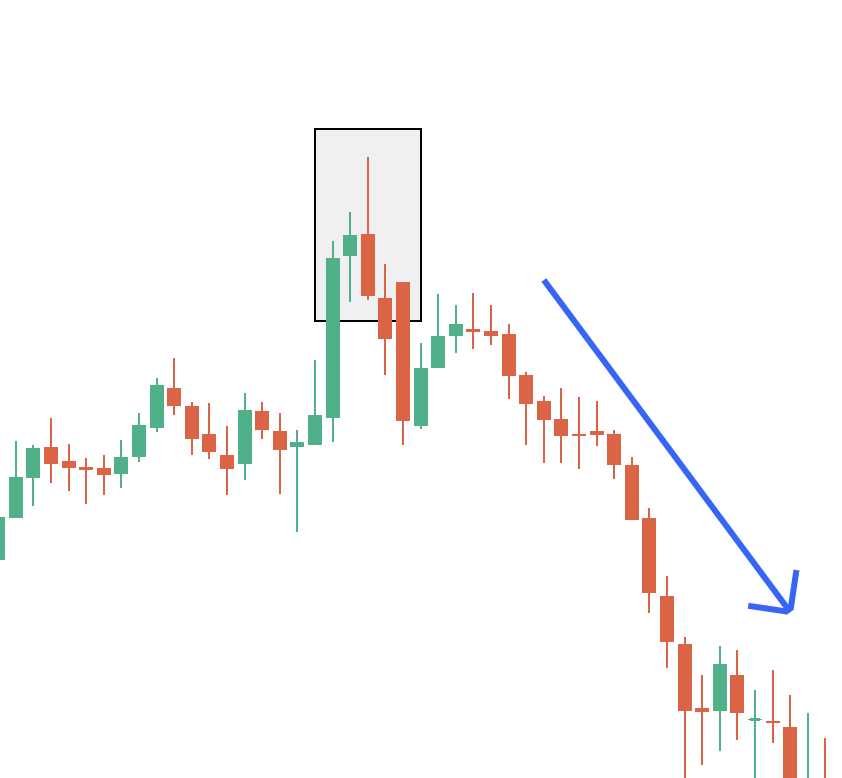
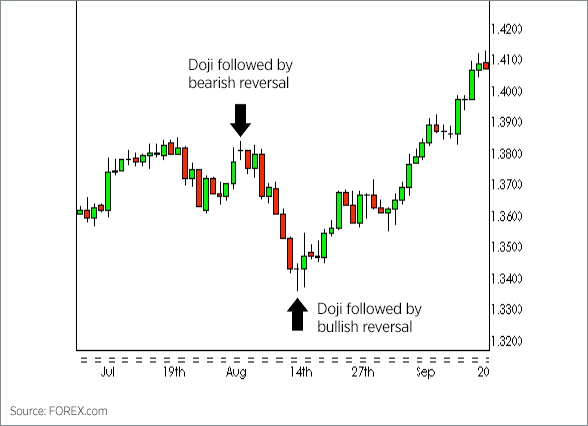

Single candlestick patterns consist of only one candle but can provide valuable information about potential market reversals.
Hammer Pattern
The hammer pattern appears after a downtrend and signals a potential bullish reversal.
Characteristics:
Small body
Long lower wick
Very little upper shadow
This pattern indicates that sellers pushed the price down but buyers regained control.
Shooting Star
The shooting star pattern appears after an uptrend and signals a possible bearish reversal.
It shows that buyers pushed the price up, but sellers eventually took control.
Doji Pattern
A Doji forms when the opening and closing prices are nearly identical.
This pattern indicates market indecision and often appears before a trend reversal.
Spinning Top
The spinning top represents a balance between buyers and sellers.
It signals that the market may pause or reverse.
Double Candlestick Patterns
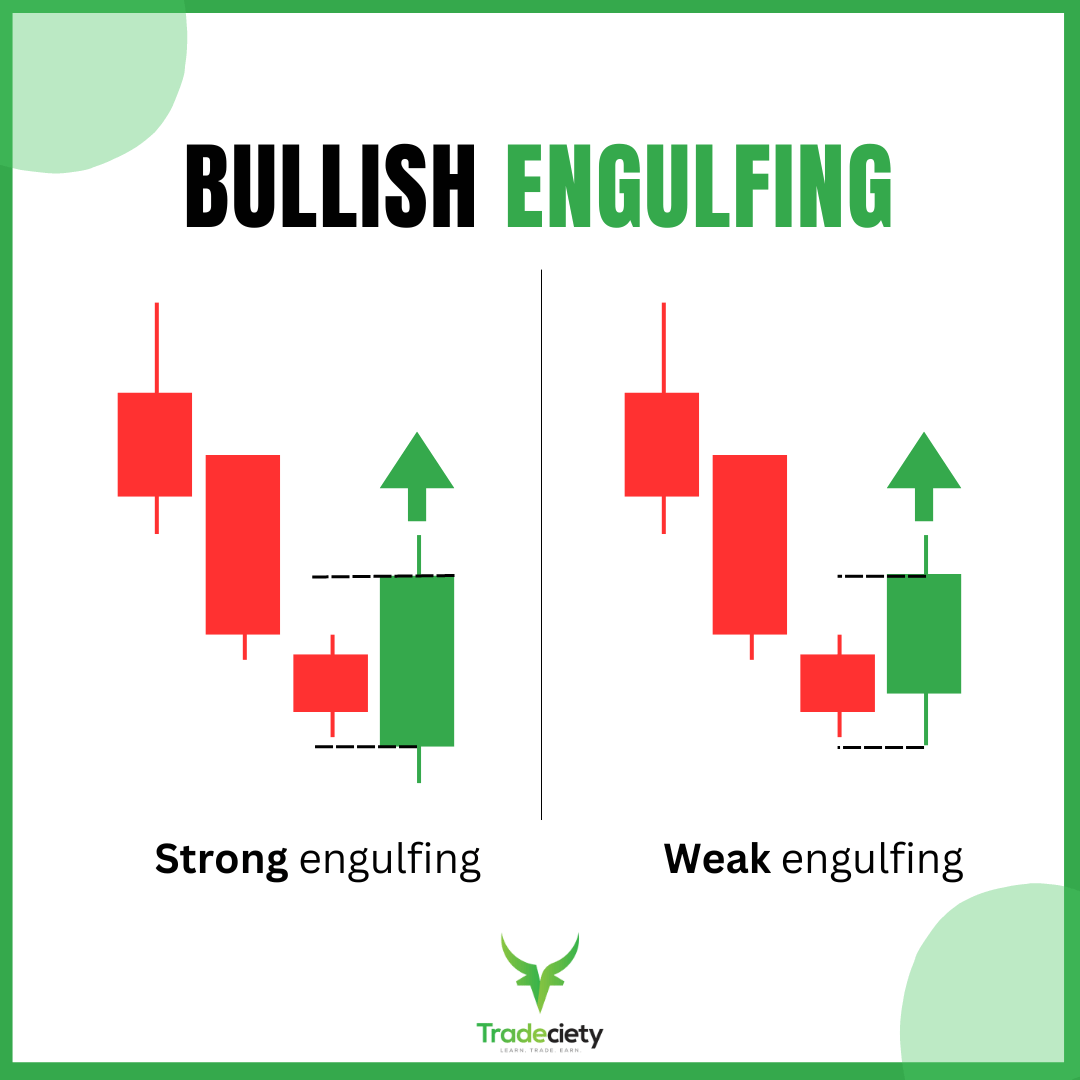
Double candlestick patterns involve two candles and usually provide stronger signals.
Bullish Engulfing
This pattern appears after a downtrend. The second candle completely engulfs the previous bearish candle.
It signals strong buying pressure and a possible upward movement.
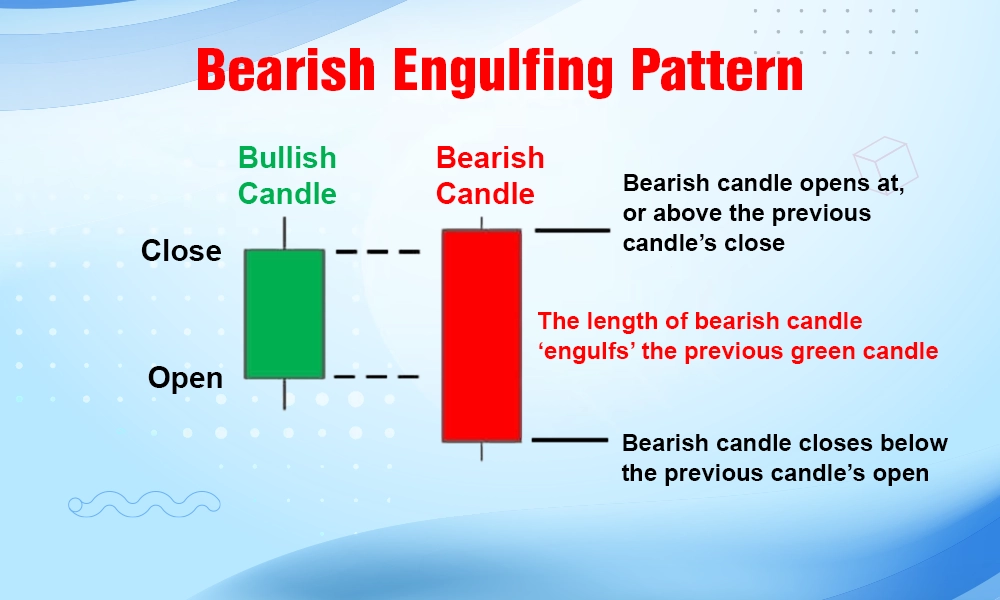
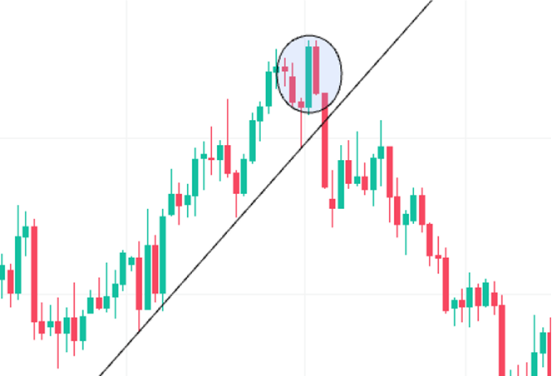
Bearish Engulfing
This pattern appears after an uptrend and indicates strong selling pressure.
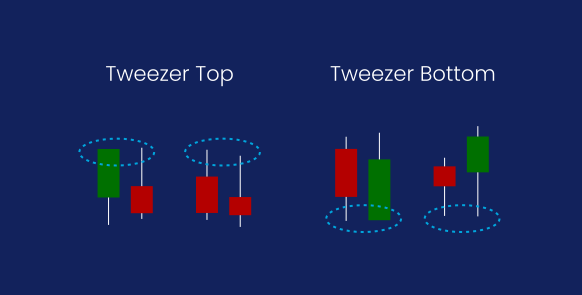
Tweezer Top
The tweezer top appears near resistance and signals a possible downward reversal.
Tweezer Bottom
The tweezer bottom appears near support and signals a potential upward reversal.
Triple Candlestick Patterns


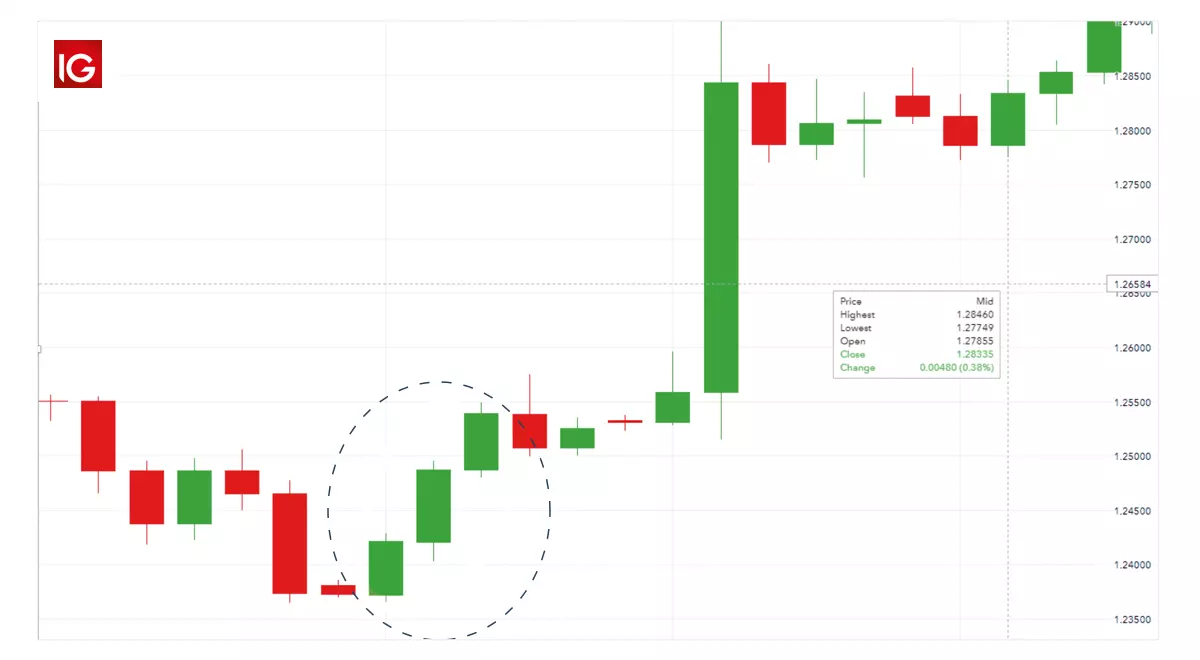
Triple candlestick patterns are among the strongest reversal signals in technical analysis.
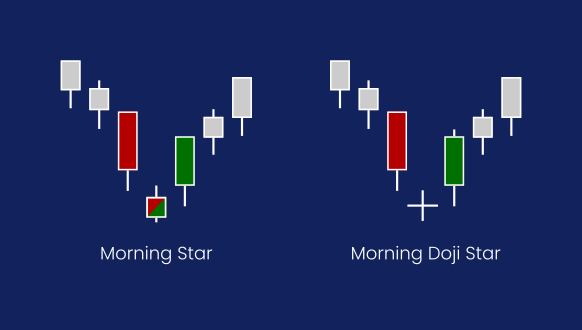
Morning Star
The morning star is a bullish reversal pattern that appears after a downtrend.
It consists of three candles and signals that buyers are taking control of the market.
Evening Star
The evening star is a bearish reversal pattern appearing after an uptrend.
Three White Soldiers
This pattern consists of three strong bullish candles and indicates a strong upward trend.
Three Black Crows
This pattern consists of three consecutive bearish candles and signals strong selling pressure.
Candlestick Trading Strategy
To trade candlestick patterns effectively, traders should combine them with support and resistance levels.
Example:
Support Level + Hammer Pattern = Buy Opportunity
Resistance Level + Shooting Star = Sell Opportunity
Steps for a simple trading strategy:
Identify the market trend
Mark important support and resistance levels
Wait for a candlestick pattern
Confirm with other indicators
Enter the trade with proper risk management
Risk Management for Traders
Successful traders focus more on risk management than on finding perfect entries.
Important rules:
Risk only 1–2% of your capital per trade
Always use a stop loss
Maintain a risk-to-reward ratio of at least 1:2
Avoid emotional trading
Best Platforms for Candlestick Analysis
Most professional traders analyze candlestick charts using platforms such as TradingView, which provides advanced charting tools, indicators, and market analysis features.
How to Practice Candlestick Trading
Beginners should practice regularly to develop strong chart-reading skills.
Recommended steps:
Analyze at least 50 charts daily
Use a demo trading account
Study past market trends
Maintain a trading journal
With consistent practice, traders can significantly improve their trading accuracy.
Conclusion
Candlestick charts are one of the most powerful tools in modern financial trading. By understanding candlestick patterns, traders can better interpret market sentiment and make informed trading decisions.
When combined with proper risk management, support and resistance analysis, and market discipline, candlestick trading can become a highly effective strategy in both Forex and cryptocurrency markets.
FAQ Schema (SEO Boost)
What is a candlestick chart in trading?
A candlestick chart is a price chart used in technical analysis that displays open, high, low, and close prices for a specific period.
How many candlestick patterns are there?
There are more than 40 candlestick patterns, but traders commonly use about 20–25 key patterns.
Which candlestick pattern is the most powerful?
Bullish engulfing, bearish engulfing, hammer, and morning star patterns are considered among the most reliable.
Can beginners use candlestick trading?
Yes. Candlestick patterns are beginner-friendly and widely used in Forex, crypto, and stock trading



0 Comments
Share your thoughts! Only real comments are appreciated. Spam will be deleted."